Introduction
Observability is essential for understanding how applications perform in production. When you can see what your systems are doing, you can make better decisions about performance, resource usage, and reliability.
I built a Monitoring Lab to compare how Go and Spring Boot applications perform under similar conditions. Both applications connect to MongoDB and perform the same operations, while Prometheus collects metrics and Grafana visualizes the results.
This article focuses on the actual results and what the metrics tell us about the performance differences between these two technologies.
The Setup
The Monitoring Lab includes two backend applications running the same workload:
- A Go application that performs MongoDB operations every 5 seconds
- A Spring Boot application performing the same operations at the same interval
- Prometheus collecting metrics from both applications
- Grafana dashboards showing real-time performance data
Both applications execute similar operations: they ping MongoDB, insert documents, and record metrics about their performance. The key difference is the technology stack each one uses.
Performance Metrics Analysis
Go Application Performance
The Go application shows consistent and efficient performance across all metrics:
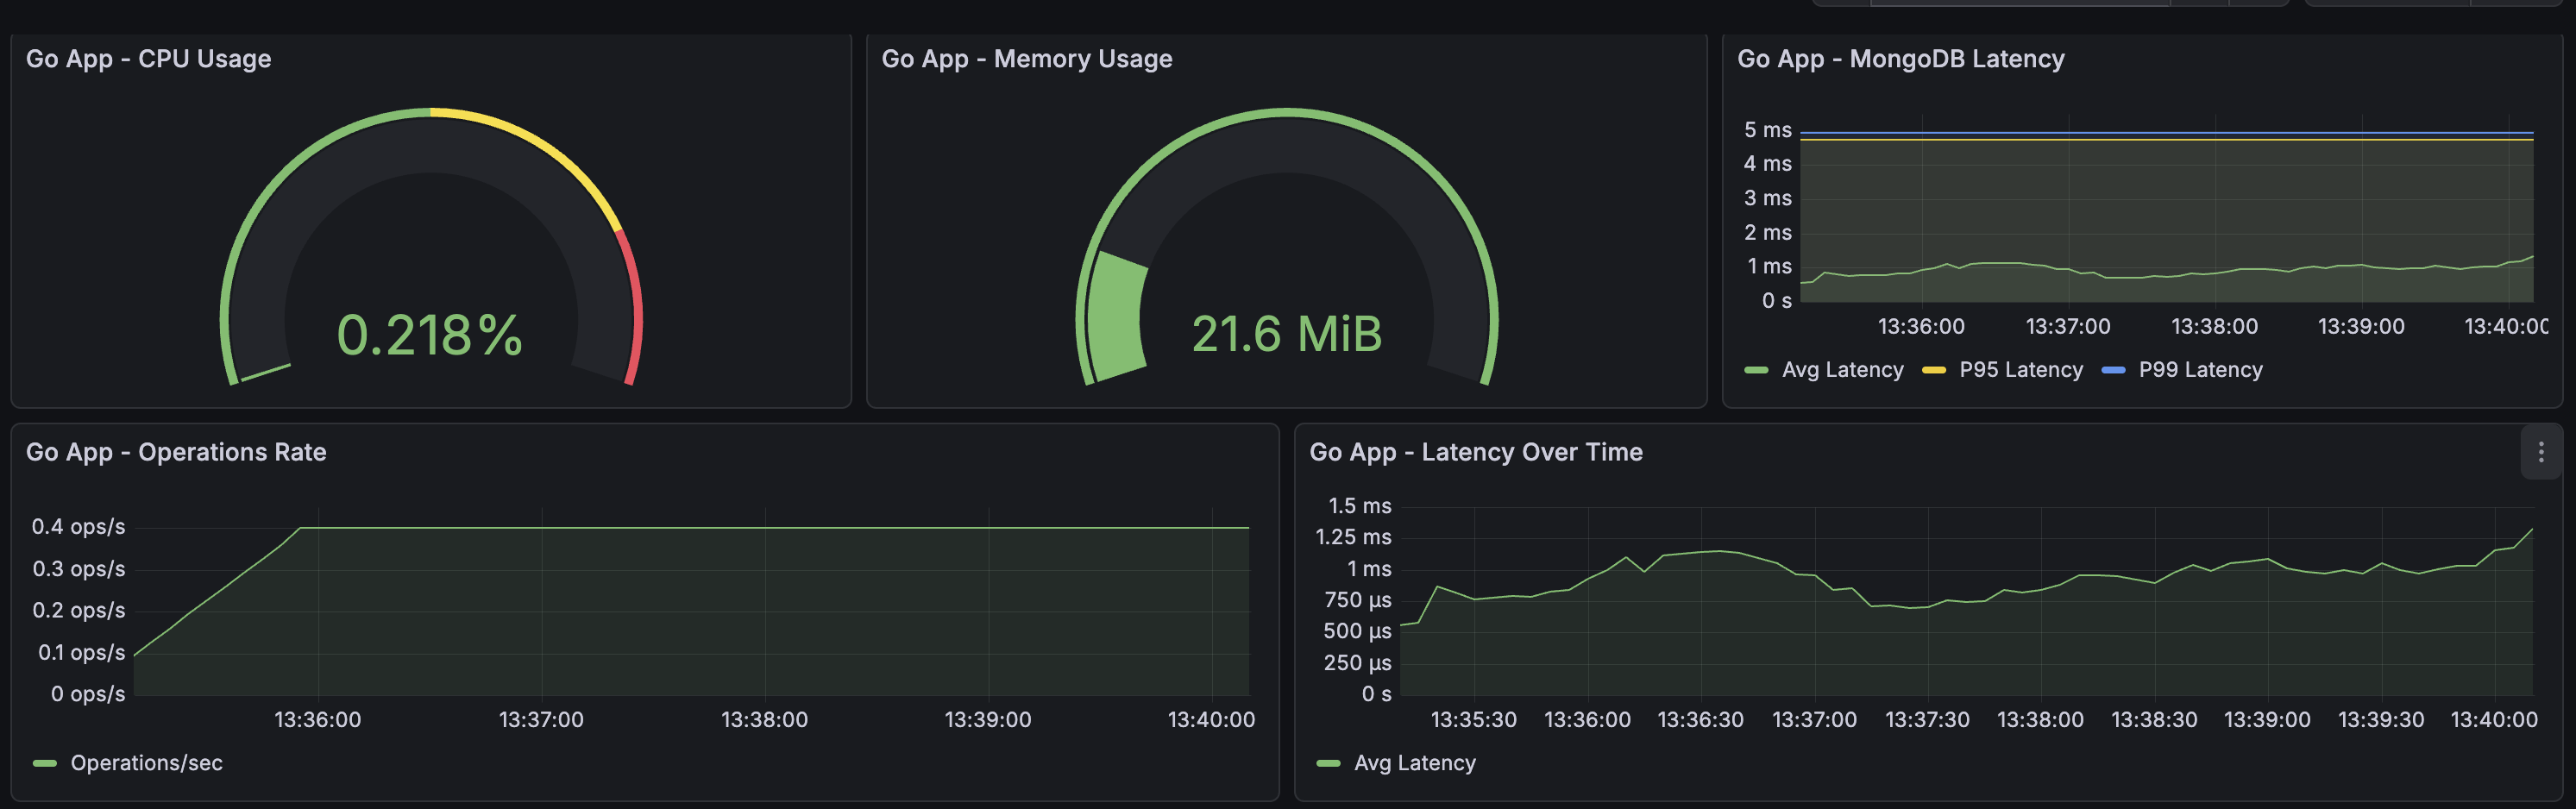
CPU Usage: The Go app maintains very low CPU usage at around 0.22%. This shows the application is lightweight and doesn’t require much processing power for these operations.
Memory Usage: Memory consumption stays stable at approximately 21.6 MiB. This is a small amount of memory, showing that Go applications can be very memory-efficient.
MongoDB Latency: The latency metrics show excellent performance:
- Average latency stays between 0.5 ms and 1.2 ms
- P95 latency (95th percentile) remains consistently around 4.5 ms
- P99 latency (99th percentile) stays around 5 ms
These numbers mean that most operations complete very quickly, and even the slowest operations are still fast.
Operations Rate: The application maintains a steady rate of 0.3 operations per second, which matches the expected interval of one operation every 5 seconds.
Spring Boot Application Performance
The Spring Boot application shows different characteristics:
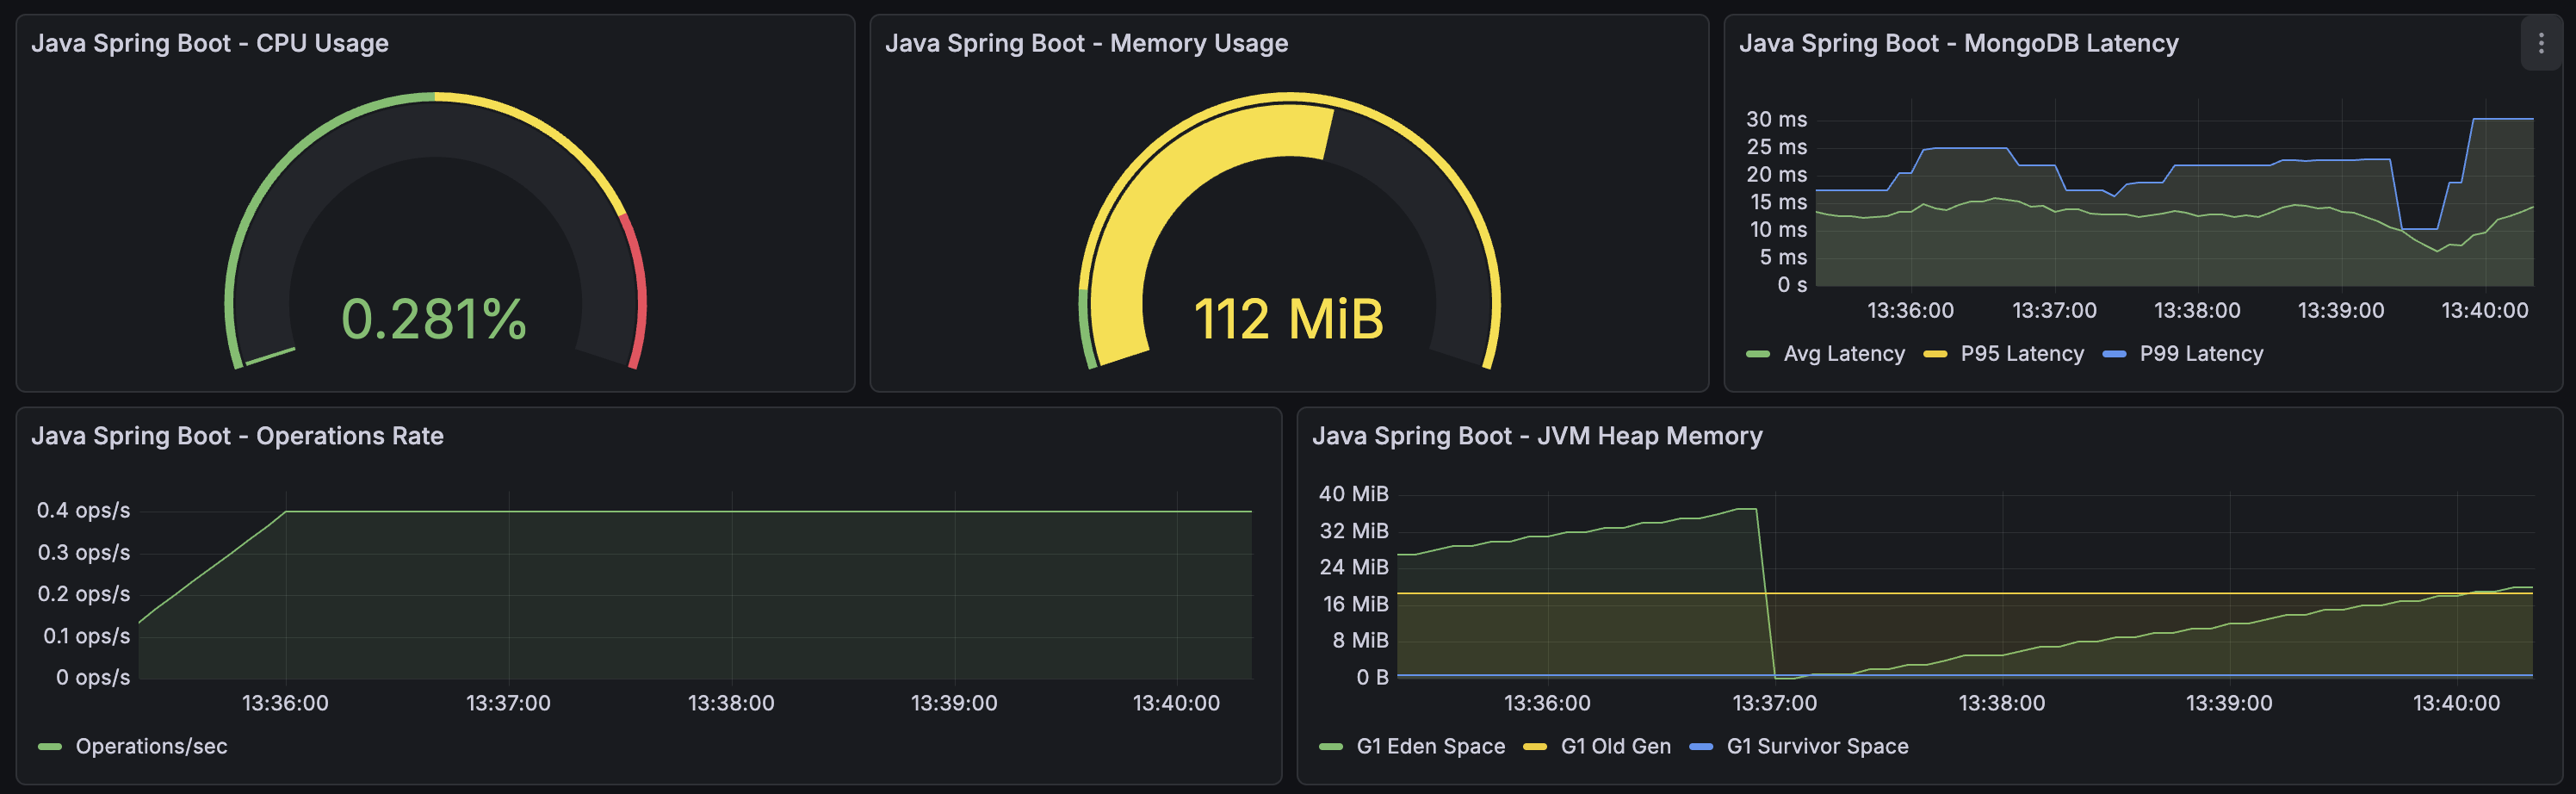
CPU Usage: Similar to Go, CPU usage is low at around 0.28%. Both applications handle the workload without stressing the CPU.
Memory Usage: This is where we see a significant difference. The Spring Boot application uses 112 MiB of memory, which is more than 5 times the memory used by the Go application. This higher memory usage is typical for Java applications due to the JVM overhead.
MongoDB Latency: The latency metrics show more variation:
- Average latency fluctuates between 10 ms and 15 ms
- P95 latency follows similar patterns to the average
- P99 latency ranges from 15 ms to 25 ms, with spikes reaching nearly 30 ms
The latency is consistently higher than the Go application, which suggests the Spring Boot application takes longer to complete the same operations.
Operations Rate: The application maintains 0.4 operations per second, slightly higher than the Go application.
JVM Heap Memory: The dashboard shows how the Java Virtual Machine manages memory:
- G1 Eden Space fills up and gets cleared during garbage collection cycles
- G1 Old Gen gradually increases over time as objects are promoted
- G1 Survivor Space remains minimal
This memory management pattern is normal for Java applications but adds overhead that Go applications don’t have.
Direct Comparison
The comparison dashboard makes the differences clear:
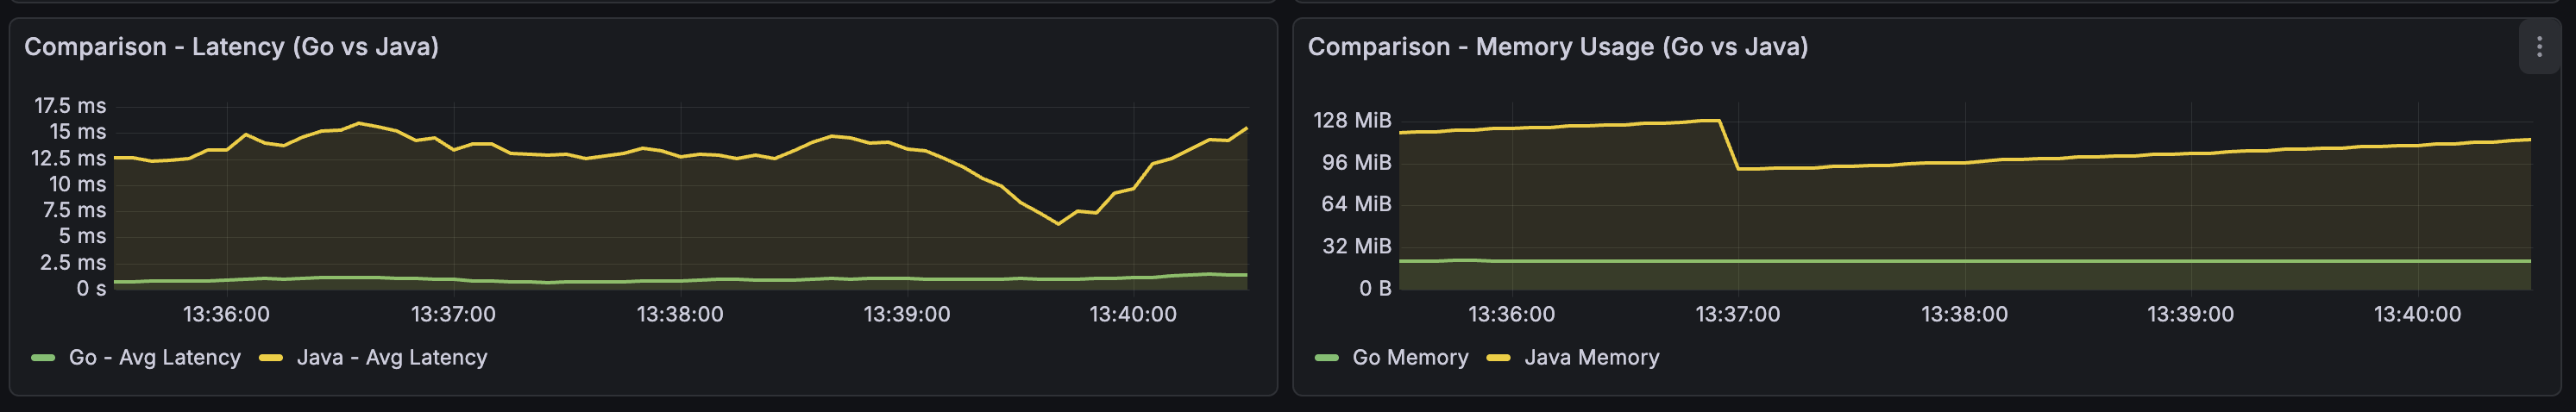
Latency Comparison:
- Go maintains average latency below 2.5 ms throughout the entire period
- Spring Boot shows average latency ranging from 6 ms to 15 ms
- Go’s latency is consistently 3 to 6 times lower than Spring Boot’s
Memory Comparison:
- Go uses between 16 MiB and 24 MiB consistently
- Spring Boot starts at 112 MiB and fluctuates between 80 MiB and 104 MiB
- Spring Boot uses approximately 4 to 7 times more memory than Go
These results show that for this specific workload, the Go application performs better in terms of both latency and memory usage.
Key Metrics Explained
Understanding these metrics helps you make informed decisions about which technology to use:
CPU Usage: Shows how much processing power the application needs. Lower is better, as it leaves more resources for other processes.
Memory Usage: Indicates how much RAM the application consumes. Lower memory usage means you can run more instances on the same server.
Average Latency: The typical time it takes for an operation to complete. Lower latency means faster responses to users.
P95 and P99 Latency: These percentiles show how the slowest operations perform. P95 means 95% of operations are faster than this value. P99 means 99% of operations are faster. These metrics help you understand worst-case performance.
Operations Rate: How many operations the application completes per second. This helps you understand throughput.
What These Results Mean
The metrics show clear patterns:
Go excels at low latency: The Go application consistently completes operations faster, with latency staying under 2.5 ms.
Go uses less memory: With memory usage around 21 MiB, Go applications can run more instances on the same hardware.
Spring Boot has higher overhead: The JVM and framework layers add overhead, resulting in higher latency and memory usage.
Both handle the workload: Neither application struggles with the workload, showing that both technologies can handle this type of operation effectively.
It’s important to remember that these results are specific to this test scenario. Different workloads, different operations, or different configurations might produce different results.
Real-World Implications
These metrics matter in production environments:
Lower latency means users get faster responses, which improves user experience. For applications handling many requests, even small latency differences can add up significantly.
Lower memory usage means you can run more application instances on the same server, which can reduce infrastructure costs. It also means applications start faster and use fewer resources.
Consistent performance is important for reliability. When latency varies widely, it’s harder to predict how the application will behave under load.
Conclusion
The Monitoring Lab provides real data about how Go and Spring Boot applications perform. The results show that for this specific workload:
- Go offers better latency performance and lower memory usage
- Spring Boot provides easier development through frameworks and tools, but with higher resource usage
- Both technologies can handle the workload effectively
The choice between technologies depends on your specific needs. If low latency and low memory usage are priorities, Go might be a better fit. If rapid development and a rich ecosystem are more important, Spring Boot might be the right choice.
Observability tools like Prometheus and Grafana make it possible to see these differences clearly. Without metrics, you’re making decisions based on assumptions. With metrics, you can make decisions based on data.
The code and dashboards are available on GitHub: https://github.com/digenaldo/monitoring-lab